Story Points: Measuring Complexity and Capacity
Published Jan 19, 2026
⦁
12 min read

Story Points: Measuring Complexity and Capacity
Story points help Agile teams estimate effort by focusing on task complexity, work volume, and risks instead of time-based predictions. This method supports better sprint planning, realistic commitments, and improved team collaboration. By using relative estimation techniques like Planning Poker and tracking velocity, teams can align workload with capacity and deliver consistently.
Key Takeaways:
- What are Story Points? A unit for estimating effort based on complexity, volume, and uncertainty.
- Why use them? They improve planning, encourage team discussions, and reduce bias.
- Challenges: Misjudging complexity, anchoring bias, and ignoring capacity can lead to poor estimates.
- Solutions: Break down large tasks, involve the whole team, and use tools like velocity tracking and Planning Poker.
Story points are not about exact predictions but creating a shared understanding to help teams plan and execute effectively.
Complete Guide to Story Points & Velocity in Agile (last video you’ll watch on this topic..)
Common Estimation Challenges
Story points are designed to balance the complexity of tasks with a team's capacity, but this balance can easily be thrown off by common missteps. These missteps often create hurdles in sprint planning, frustrate stakeholders, and leave developers feeling stretched too thin. Identifying where things go wrong is the first step to improving the estimation process. The challenges usually fall into two main areas: assessing complexity and aligning estimates with team capacity.
Inaccurate Complexity Assessments
One major stumbling block is a lack of agreement on what’s actually being estimated. For instance, one team member might provide an optimistic, best-case estimate, while another leans toward a more cautious, risk-averse estimate. This mismatch can make the numbers meaningless. To put it in perspective, a best-case estimate might only be accurate 10% of the time, while a risk-averse estimate could be exceeded 90% of the time.
Another issue is anchoring bias. If someone throws out a number first - whether it’s a team member or a Product Owner casually labeling a task as "small" - it can influence the entire group’s estimates. That’s why techniques like Planning Poker, where estimates are revealed simultaneously, are so effective in reducing bias. You can even run instant planning poker in Slack to keep the process seamless for remote teams.
Teams also struggle with tasks that are too large to estimate confidently. Research shows people are generally good at estimating tasks within one order of magnitude. However, when tasks exceed 16 hours of work or 20 story points, hidden complexities like legacy code or unexpected dependencies often go unnoticed.
"Leaving part of the broader product team out of the estimation process creates lower quality estimates, lowers morale because key contributors don't feel included, and compromises the quality of the software." - Atlassian
Another common mistake is overlooking the Definition of Done. If estimates don’t include time for automated testing, documentation, or code reviews, they’re bound to fall short. Similarly, excluding key roles like QA engineers or designers can leave "hidden dragons" - technical challenges that developers might not foresee.
Capacity Misalignment
Even when complexity is estimated correctly, aligning those estimates with the team’s actual capacity can be tricky. A mismatch between story points and what the team can realistically handle can derail a sprint. Overloading the team risks burnout and reduced quality, while underestimating capacity can lead to inefficiencies, with work expanding to fill the available time.
Poor estimations also impact decision-making and stakeholder trust. Product Owners depend on accurate effort estimates to prioritize tasks in the backlog. When estimates are off, high-effort, low-value tasks can take precedence over more efficient options, wasting time and resources.
"Filling the maximum possible capacity of your Agile team can be very risky." - Agnieszka Sienkiewicz, Content Writer, BigPicture
It’s also important to account for the overhead that comes with a developer’s day-to-day work. Meetings, administrative tasks, and helping teammates typically take up about 25% of their time. This means only 75% of their capacity should be allocated to story work. For new Agile teams, this figure can be even lower, with some delivering just 10% of their estimated stories during early sprints.
Treating velocity as a fixed commitment instead of a flexible guide only adds to the problem. When teams feel pressured to hit specific velocity numbers, it can lead to stress, missed deadlines, and broken commitments, ultimately damaging their credibility with stakeholders.
Measuring Complexity with Story Points
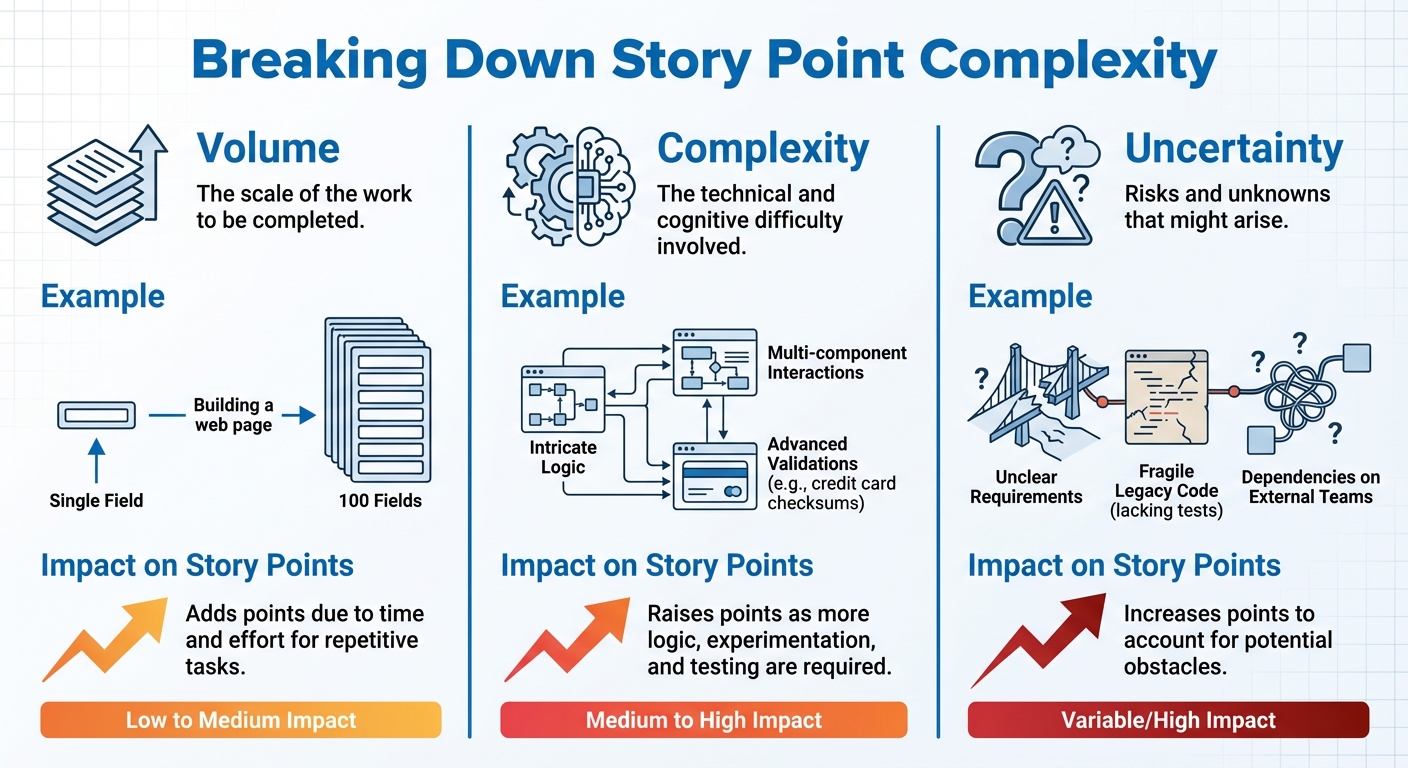
Story Point Complexity Factors: Volume, Complexity, and Uncertainty Impact
Story points capture the essence of task difficulty by factoring in work volume, technical challenges, and potential risks. As Mike Cohn explains, story points represent the effort required to complete a task, taking into account elements like risk, uncertainty, and complexity. This broad definition provides a framework for understanding how these factors influence story point estimates.
Breaking Down Complexity
When estimating tasks, consider their volume, complexity, and uncertainty:
- Volume: The sheer amount of work involved. For example, building a web page with 100 text fields requires far more effort than one with just a single field.
- Complexity: The mental and technical challenges. This might include intricate logic, interactions between multiple components, or advanced validations like credit card checksums.
- Uncertainty: The unknowns that could complicate the task, such as unclear requirements, fragile legacy code lacking tests, or dependencies on external teams or systems.
Here’s how these factors influence story point estimates:
| Factor | Description | Impact on Story Points |
|---|---|---|
| Volume | The scale of the work to be completed. | Adds points due to the time and effort for repetitive tasks. |
| Complexity | The technical and cognitive difficulty involved. | Raises points as more logic, experimentation, and testing are required. |
| Uncertainty | Risks and unknowns that might arise. | Increases points to account for potential obstacles. |
Relative Estimation Techniques
Once you’ve defined these factors, relative estimation methods can help your team size tasks consistently. The power of story points lies in their relativity - comparing tasks against a known baseline. For instance, a 5-point story should feel about twice as challenging as a 3-point story, regardless of individual skill levels.
Using the Fibonacci sequence (1, 2, 3, 5, 8, 13) aligns with the idea that uncertainty grows as tasks become larger, avoiding unnecessary debates over minor differences.
To get started, establish a baseline with a simple 1- or 2-point story, such as fixing a known bug. Then, use Planning Poker: team members reveal their estimates simultaneously to prevent anchoring bias. When there’s a wide gap in estimates - say, one person votes 3 while another votes 13 - discussing the differences can uncover hidden risks or highlight shortcuts that only some team members are aware of.
Aligning Story Points with Team Capacity
Once you've gauged task complexity, the next step is to align those estimates with your team's actual capacity. This is where velocity and capacity planning come into the picture. These two concepts work hand-in-hand to help you set achievable sprint goals.
Understanding Velocity
Velocity represents the total story points your team completes during a sprint. Think of it as a speedometer for your team's work output. To get an accurate measure, calculate an average based on the last three to five sprints. This helps smooth out any irregularities.
"Velocity is a planning metric, not a performance indicator." - Scrum Alliance
While velocity gives you a snapshot of past performance, it doesn’t account for future variables. That’s where capacity planning steps in - it estimates how much actual work time your team will have in an upcoming sprint. For example, if some team members are out on vacation, your capacity will naturally decrease, even if your historical velocity remains steady.
Capacity Planning with Story Points
To avoid overloading your team, adjust your velocity target based on their availability. For instance, if you know your team’s capacity will drop by 10% due to holidays, multiply your average velocity by 0.9. So, if your usual velocity is 30 points, your target for the sprint should be 27 points. Many teams plan for 75–85% of their average velocity to leave room for unexpected issues. This buffer also accounts for time spent on administrative tasks and team ceremonies, which typically take up 20–25% of available hours.
For even greater accuracy, you can use the 90% confidence interval method. Here’s how it works: gather velocity data from eight sprints, rank them from lowest to highest, and use the second-lowest value as your low range and the second-highest value as your high range. Start by assigning high-priority tasks to the lower end of the range, then use any remaining capacity for less critical work. This method acknowledges the uncertainty inherent in complex tasks by treating velocity as a flexible range rather than a fixed target.
Tools for Better Story Point Estimation
Planning Poker for Team Estimation
Planning poker is a collaborative approach that gets the entire team involved in estimating tasks. Instead of a single person assigning points, everyone - developers, testers, and designers - chooses a card privately to represent their estimate. Then, all cards are revealed at the same time, encouraging unbiased participation and reducing the influence of anchoring.
When there are large differences in estimates, such as one person voting "3" and another voting "13", it sparks a discussion. These conversations often highlight hidden risks or overlooked shortcuts, making the process more thorough.
To make the process smoother, teams can establish baseline examples - like defining what a "2-point" or "5-point" story looks like. These references help ensure consistency in future estimations. This structured yet flexible method lays the foundation for using tools that can further improve the estimation process.
Using iAmAgile for Agile Estimation
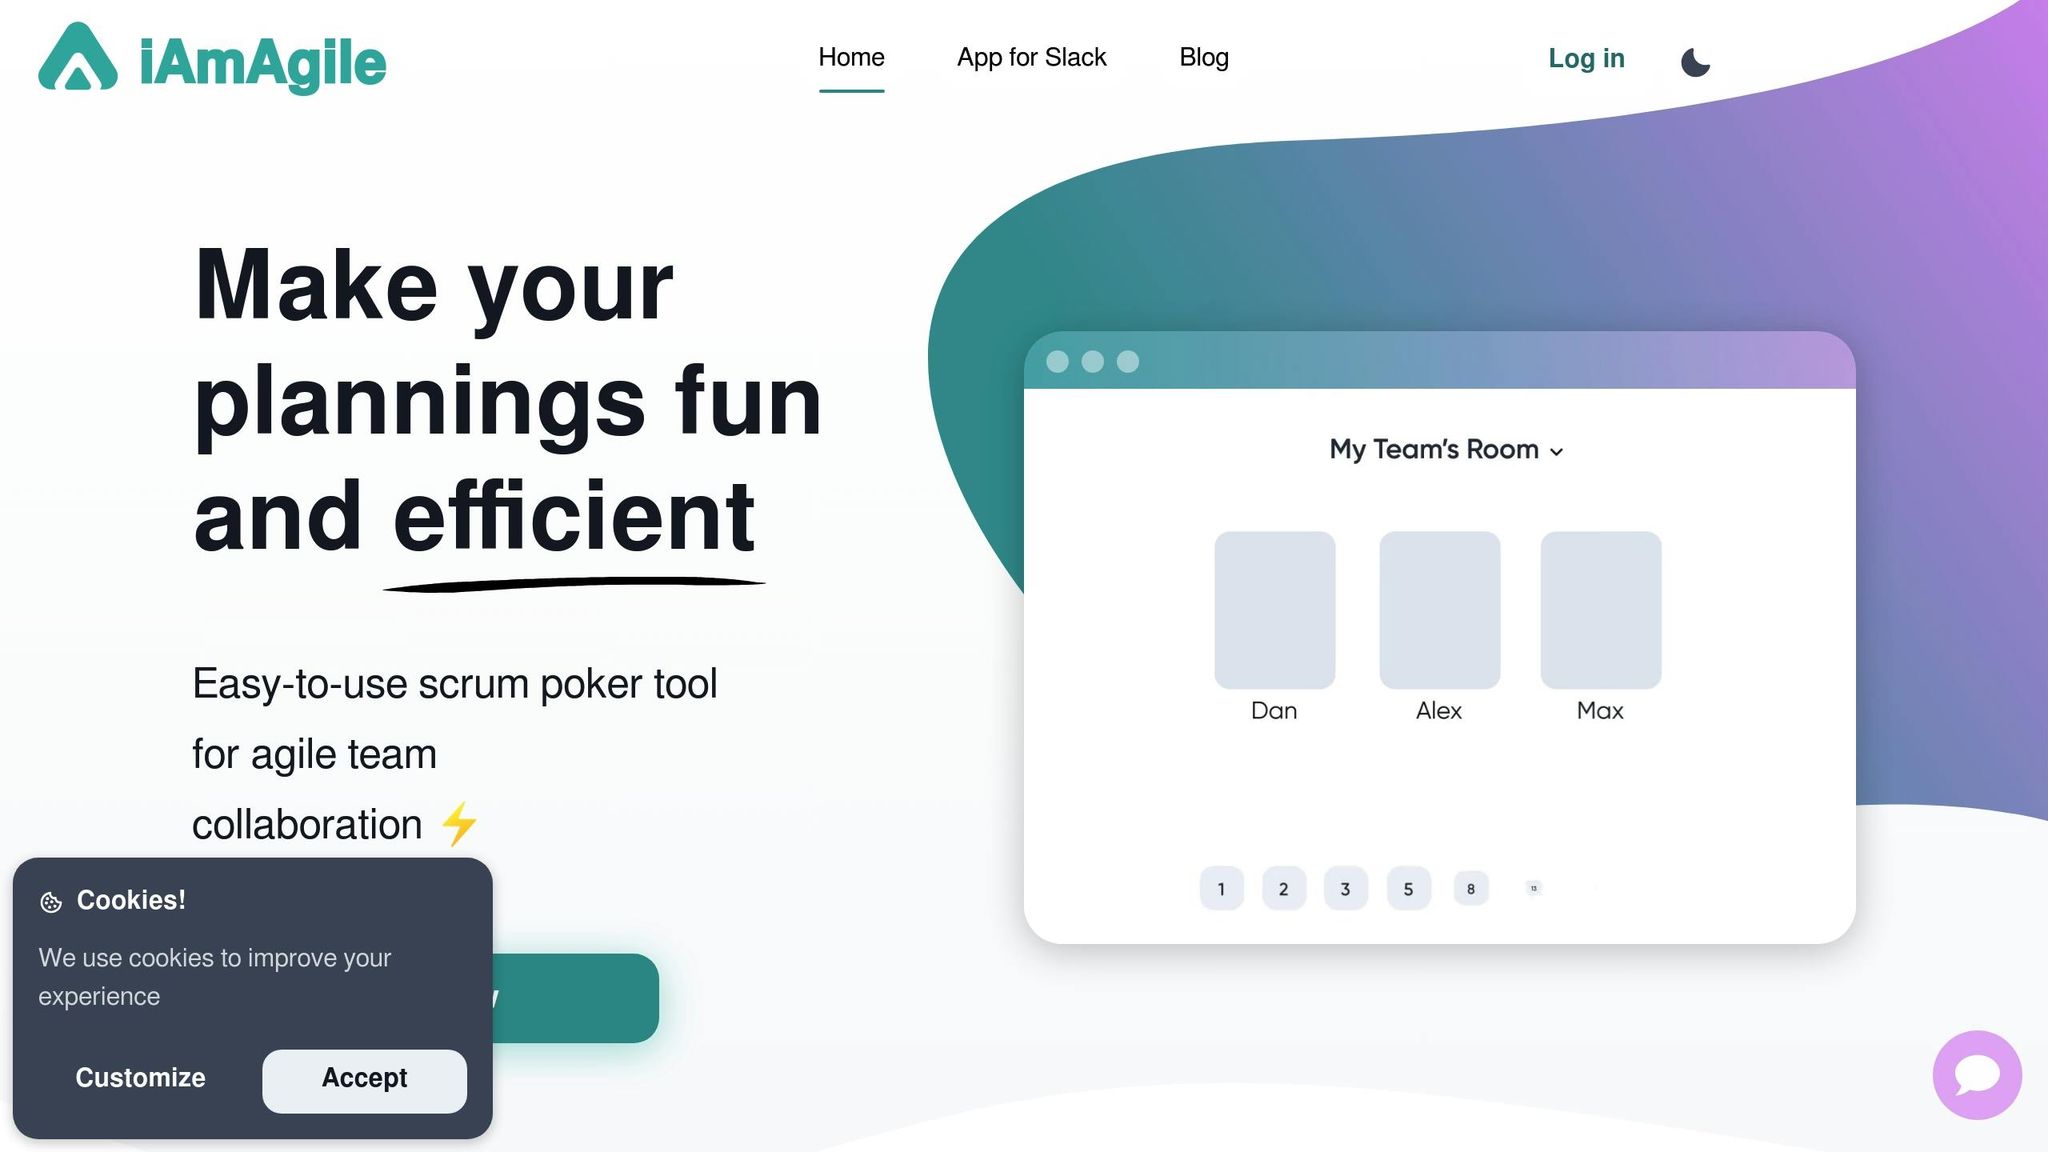
Building on techniques like Planning Poker, tools such as iAmAgile's Scrum poker make the estimation process even more efficient. Designed to work seamlessly with distributed teams, this tool integrates directly with Slack, allowing team members to estimate tasks without leaving their usual communication platform.
iAmAgile offers customizable voting scales, including options like the Fibonacci sequence or T-shirt sizing, which can be adapted to match your team's experience with Agile practices. The tool also supports mobile access, making it easier for team members to participate from any device. By focusing on the relative complexity of tasks instead of estimating hours, it helps remove emotional ties to deadlines and acknowledges that individual developers may work at different speeds.
Improving Delivery Through Continuous Refinement
Refining estimation practices over time ensures that your team’s assessment of task complexity stays in sync with its evolving capacity.
Learning from Past Sprints
Use historical sprint data to improve the accuracy of your estimates. A good starting point is tracking your team’s velocity - essentially, the average number of story points completed per sprint - over at least five iterations. This data provides a solid baseline for understanding what your team can reliably deliver.
During sprint retrospectives, revisit the last five stories assigned the same point value. Were they genuinely similar in effort? If not, dig into the reasons. For example, tasks involving legacy code might consistently take longer, or third-party integrations could introduce unexpected delays. Recognizing these trends allows you to account for hidden risks when estimating similar tasks in the future.
"Retrospectives are a time for the team to incorporate insights from past iterations–including the accuracy of their estimates." - Atlassian
You can also use triangulation to validate estimates. Compare a new task to two previously completed tasks with similar point values. This method ensures the estimate aligns with your existing scale. Over time, these insights help refine and simplify estimation practices for future sprints.
Refining Estimation Practices
As your team gains experience, it’s essential to adjust your estimation criteria to reflect that growth. Tasks that once seemed complex may now be routine, so make sure to update your baseline reference stories accordingly.
When planning sprints, consider using a velocity range instead of a single number. Analyze historical highs and lows, and plan within a range - typically 75–85% of the average velocity. This approach builds in a buffer for interruptions, leading to more realistic forecasts and less pressure to overcommit.
If large stories (e.g., those with 13 or 20 points) frequently face delays, break them into smaller tasks. Additionally, have the team members with the highest and lowest estimates explain their reasoning. This discussion often reveals hidden complexities or misunderstandings. The Fibonacci sequence is particularly helpful here, as it naturally highlights the growing uncertainty associated with larger values.
Conclusion
Story points provide a useful way to measure task complexity and team capacity. By focusing on relative effort rather than exact durations, they help avoid unnecessary debates and prevent biases related to individual skills. This approach keeps everyone focused on the shared goal: delivering what the team has committed to.
Tracking velocity - the average number of story points your team completes in a sprint - is crucial for ensuring predictable delivery. Studies indicate that monitoring velocity can improve estimation accuracy by up to 40% and enhance release predictability by 25%. By leveraging historical velocity, teams can create more realistic plans and forecasts grounded in actual data.
"Story points are a powerful way to gauge the total effort to complete a task, rather than just get fixated on the time it will take." - Jory MacKay, Planio
Modern tools make estimation even more efficient. For example, iAmAgile simplifies the process with features like Slack integration, customizable voting scales, and mobile access for digital Planning Poker sessions. These tools help maintain consistency in collaborative estimation practices.
Over time, as your team refines its approach to estimation, you'll develop a deeper shared understanding and build a reliable foundation of historical data. Story points do more than quantify work - they create a shared language that helps teams deliver value consistently, sprint after sprint.
FAQs
What’s the difference between story points and time-based estimates in Agile planning?
Story points are a way to measure tasks relatively in Agile, focusing on effort, complexity, and risk by comparing tasks against one another. Unlike time-based estimates, which tie tasks to specific hours or days, story points center on the overall challenge rather than pinpointing exact durations.
Time-based estimates often give an illusion of precision, while story points encourage teams to consider the broader scope of a task's difficulty. This method shifts the focus toward team collaboration and capacity planning, rather than sticking to strict timelines, making it especially effective for Agile's iterative workflows.
What are some common mistakes in estimating story points, and how can teams avoid them?
One frequent misstep in estimating story points is approaching the process as a fixed, one-and-done task rather than an ongoing, collaborative effort. Estimating all backlog items upfront can box the team into a rigid scope, limiting the ability to adapt and refine as the project evolves. Another common mistake is involving only select team members, such as a senior developer or product owner. This approach can skew results, as different roles often have unique perspectives on risks and complexities. Similarly, relying on simple averages of differing votes, skipping multiple estimation rounds, or demanding precise point values can lead to unreliable projections. Misusing story points as a performance metric or assigning points after the work is done further erodes their purpose and can hurt team morale.
To steer clear of these issues, make estimation a collaborative, ongoing process that includes the entire team. Techniques like planning poker encourage open discussions, surface hidden assumptions, and help the team align on estimates. Tools such as iAmAgile can enhance this process by enabling real-time voting and offering customizable scales. Aim for at least two rounds of estimation: the first to highlight discrepancies and the second to refine estimates after addressing any questions. Remember, story points are meant for forecasting, not evaluating performance. Regularly reviewing past sprint data can also help fine-tune the team’s velocity. Lastly, ensure backlog items are small and clearly defined, and avoid assigning points retroactively to maintain the integrity of this metric as a planning tool.
How can teams ensure their story point estimates reflect their actual capacity?
To make story point estimates match the team's actual capacity, it's helpful to start with the team's historical velocity as a reference point. From there, adjust the estimates based on how available the team will be for the upcoming sprint. This means factoring in things like planned vacations or other commitments that might impact productivity.
Holding regular planning poker sessions is another great way to fine-tune the estimation process. These sessions promote consistency in how the team evaluates complexity. On top of that, taking time during retrospectives to review past estimates can highlight any gaps or inaccuracies, offering a chance to improve future estimations. By repeating this process, teams can keep their estimates practical and in sync with their actual capacity.
Ready to improve your team's planning?
Put what you've learned into practice! Make your next planning session more engaging and accurate.
Try for free - no signup required